Design a Color Weather Dashboard with Arduino
Build a small color weather dashboard with an Arduino Uno, a DHT22 temperature and humidity sensor, and an ILI9341 TFT display. The Arduino reads the room conditions, draws separate dashboard cards, and uses color to show whether the room feels cool, comfortable, warm, dry, or humid.
Live project track
Have you ever checked a weather app and understood the room at a glance, even before reading every number? That is the power of a dashboard. It does not only show data. It organizes the data so your eyes know what matters first.
In this project, you will build that same idea on a small Arduino setup. The DHT22 measures temperature and humidity, and the ILI9341 TFT display turns those two readings into a colorful room weather dashboard. The main concept is simple: a display becomes more useful when sensor numbers are grouped into clear visual areas with labels, color, and status.
DHT22 Readings Become Dashboard Cards
Think about a car dashboard. It could show every value as a plain line of text, but that would be tiring while driving. Instead, speed, fuel, warning lights, and status indicators each get their own space. Your eyes learn where to look.
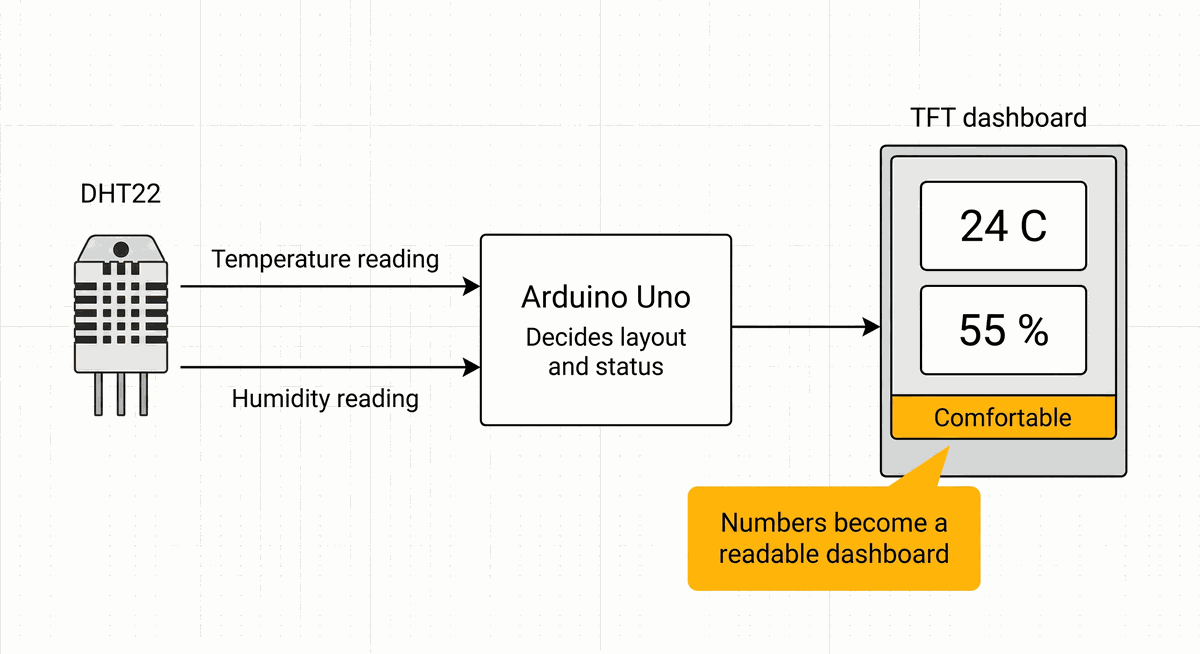
This Arduino dashboard uses the same beginner-friendly idea. Temperature gets one card, humidity gets another card, and the comfort message gets a wide strip near the bottom. The Arduino still only has two sensor readings, but the screen layout makes those readings feel easier to understand.
| Raw sensor value | Dashboard meaning | Where it appears |
|---|---|---|
| Temperature in C | How warm or cool the room feels | Left value card |
| Humidity in percent | How much moisture is in the air | Right value card |
| Comfort decision | A human-readable room status | Bottom status strip |
The important lesson is that a dashboard is not just a prettier display. It is a decision about information priority. The big numbers answer what is happening now. The colored status strip answers what should I think about this reading? That second question is what makes the project feel more useful than printing values to Serial Monitor.
Color Makes Room Status Faster To Read
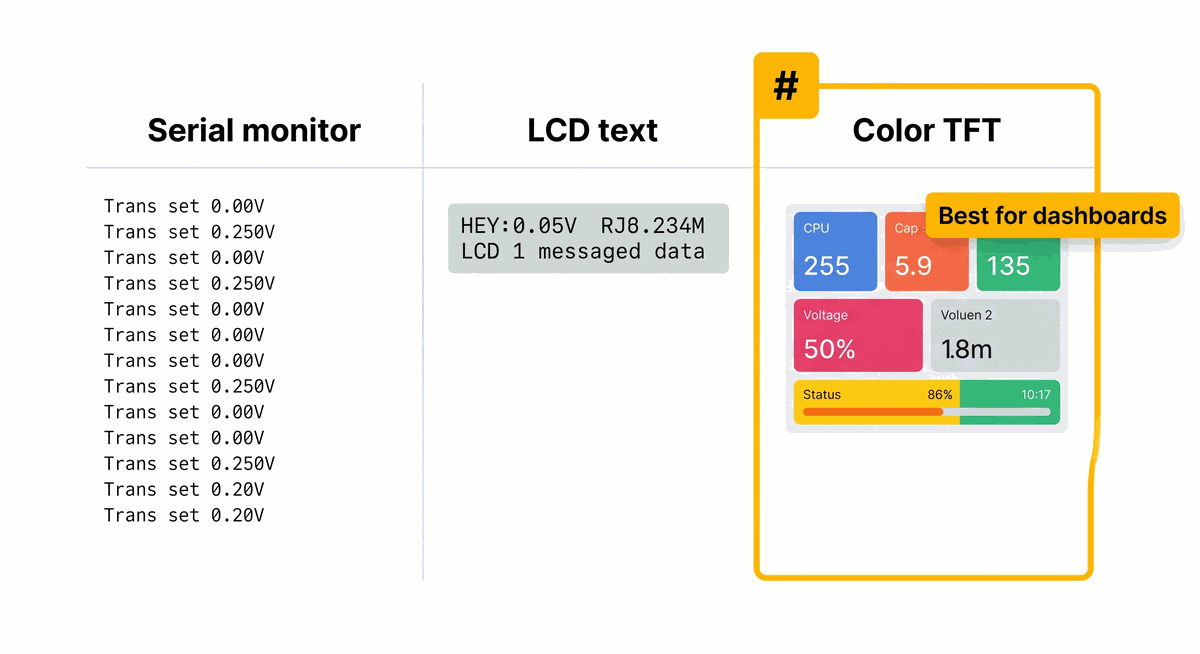
A 16x2 LCD can show the same temperature and humidity numbers, but it has very little room for layout. Serial Monitor can show even more text, but it is tied to the computer. A color TFT sits in the middle: it is still small, but it can draw sections, large text, and colored feedback.
| Output style | What it is good for | What feels limited |
|---|---|---|
| Serial Monitor | Debugging while connected to a computer | Not a standalone interface |
| Character LCD | Simple values and short labels | Very little space for layout |
| Color TFT | Cards, status colors, labels, and dashboard screens | Needs more drawing code |
For this project, the TFT is not just decoration. The color and layout are part of the lesson: sensor data becomes easier to read when the screen gives each value a clear role.
The dashboard uses yellow for the temperature value, cyan for humidity, and a changing color strip for the room status. That color strip is useful because the reader does not need to compare numbers every time. Green means comfortable. Cyan means cool. Orange means warm. Yellow points to dry air, and blue points to humid air.
Comfort Zones Turn Numbers Into Plain Language
Temperature and humidity are numbers, but people usually think in descriptions: cool, warm, dry, humid, or comfortable. The code creates those descriptions by comparing the DHT22 readings against simple thresholds.
A threshold is a line in the sand. If the temperature is below or equal to 20 C, the room is labeled cool. If it is above or equal to 28 C, the room is labeled warm. For humidity, 40 percent or lower is treated as dry, while 65 percent or higher is treated as humid.
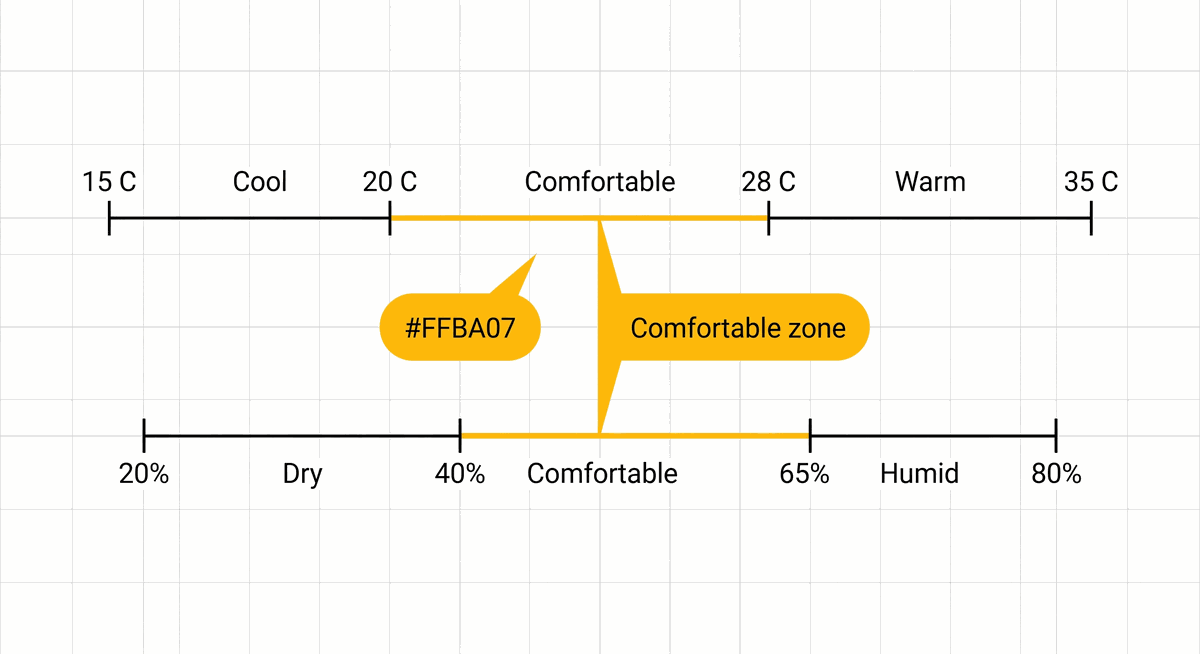
- Cool room appears when the temperature is 20 C or lower.
- Warm room appears when the temperature is 28 C or higher.
- Dry air appears when humidity is 40 percent or lower.
- Humid air appears when humidity is 65 percent or higher.
- Comfortable appears when the readings stay inside the middle range.
These thresholds are intentionally easy to change. They are not meant to be perfect weather science. They are a clear way to teach the dashboard pattern: read data, compare it to a few limits, then show a status that a person can understand quickly.
The DHT22 Refresh Pace Keeps the Dashboard Stable
The DHT22 is a steady environment sensor, not a fast button. It measures temperature and humidity slowly compared with many Arduino inputs. Reading it every two seconds is a safe beginner habit because it gives the sensor time to update before the next screen refresh.
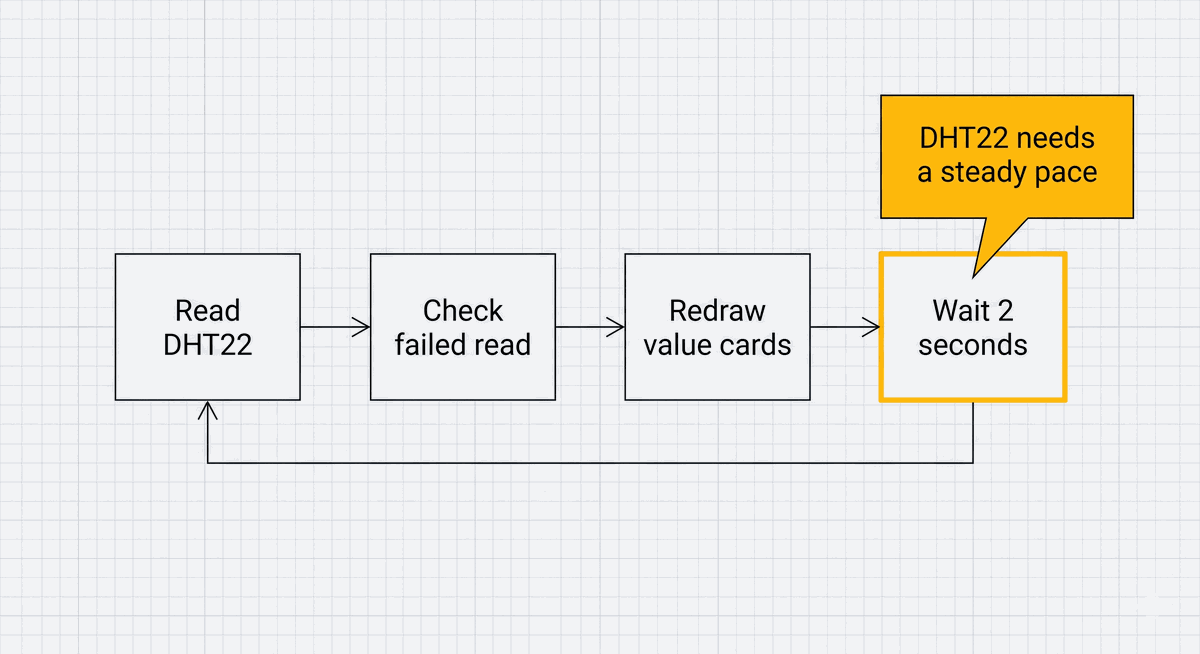
The dashboard follows a gentle loop. It reads the sensor, checks whether the reading failed, redraws only the value areas, then waits before trying again. This is why the screen feels stable instead of constantly flickering. The layout stays in place, and only the parts that can change are refreshed.
Each Weather Dashboard Wire Has a Display or Sensor Job
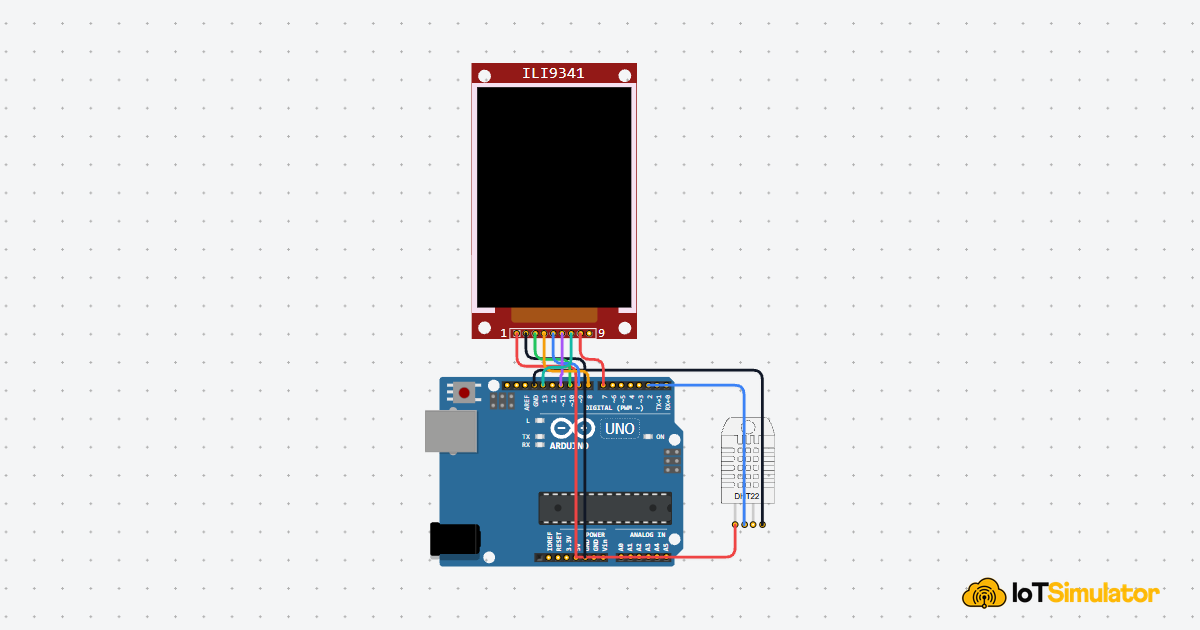
The circuit has two groups of connections. The DHT22 group is small because the sensor only needs power, ground, and one data line. The TFT group is larger because a color screen needs power, a backlight line, and several SPI/control signals.
5V is the positive power supply from the Arduino. It is where the DHT22 and display get the energy they need to run. GND is the return path for electricity, like the negative terminal of a battery. All components must share GND so their signals mean the same thing electrically.
Powers the temperature and humidity sensor.
Carries the digital temperature and humidity data to the Arduino.
This pin is unused and should be left open.
Shares the same electrical reference as the Arduino.
The ILI9341 display uses SPI. SPI is a fast way for the Arduino to send a stream of drawing commands and pixel data to the screen. MOSI carries data from the Arduino to the display, and SCK carries the clock that keeps the data timing organized.
Powers the TFT display module.
Completes the display power circuit and shares a signal reference.
Selects the TFT display when the Arduino sends SPI data.
Lets the sketch reset the display controller.
Tells the display whether incoming data is a command or screen content.
Sends drawing data from the Arduino to the display.
Sends the SPI clock signal that times each data bit.
Turns the display backlight on in this project.
This dashboard only sends data to the display, so the return data pin is not needed.
If the TFT backlight turns on but the screen stays blank, checkCS,D/C,RST,MOSI, andSCK. Power alone can light the panel, but the control and SPI wires are what make it draw.
The Complete Color Weather Dashboard Sketch
This sketch reads the DHT22 every two seconds and updates a landscape dashboard on the ILI9341 display. The code uses helper functions because a dashboard has repeated drawing jobs: draw the fixed layout once, redraw changing values, show an error message, and choose the comfort label.
That makes this an intermediate project, but the idea is still friendly: each function has one clear job. If you want to tune the project later, the threshold constants near the top are the safest place to start.
How the Weather Dashboard Code Works, Part By Part
The code is easier to understand if you follow the flow of the dashboard. First it names the pins and limits. Then it starts the sensor and screen. After that, the loop reads the room and sends the latest values to the drawing functions.
▸ Weather Dashboard Libraries and Tunable Limits
The sketch loads four libraries. SPI handles the fast display communication. Adafruit_GFX provides drawing tools like rectangles and text. Adafruit_ILI9341 knows the display controller, and DHT reads the temperature and humidity sensor.
The limit constants are the main settings for the project. Changing warmLimitC from 28.0 to 30.0 would make the dashboard wait for a warmer room before showing the warm status.
▸ Dashboard Objects Connect Code To Components
The DHT object stores the sensor pin and sensor type. The TFT object stores the display control pins. These objects are the bridge between readable Arduino code and the actual wires in the circuit.
▸ Setup Draws the Dashboard Frame Once
In setup(), the backlight pin is set as an OUTPUT, which means the Arduino controls it. Writing HIGH turns that pin on, so the TFT backlight becomes visible.
The sensor and display are then started with dht.begin() and tft.begin(). The display is rotated into landscape mode, and drawStaticLayout() draws the title, cards, and status outline once at startup.
▸ Loop Refreshes Only Changing Values
The loop asks the DHT22 for humidity and temperature. If either reading fails, isnan() catches it and the dashboard shows a wiring warning instead of pretending the numbers are valid.
The two-second delay is part of the design. It protects the DHT22 from being read too quickly and gives the screen a calm refresh rhythm.
▸ Value Cards Erase Before Redrawing
Before printing a new temperature or humidity value, the code fills the old value area with the same dark card color. This prevents leftover characters from previous readings. For example, without clearing the value area first, 24.0C could leave extra characters after a later shorter value.
▸ Status Strip Matches the Room Condition
The status strip uses two helper functions. One chooses the color, and the other chooses the text. Both functions look at the same readings, so the label and the color stay consistent.
▸ Threshold Order Decides the Message
The label function checks temperature before humidity. That means an obviously cool or warm room gets the main message first. If the temperature is in the comfortable middle range, the function then checks whether the air is too dry or too humid.
Adjusting the Dashboard For Your Room
If your room usually sits around 29 C and you do not want it labeled warm all day, raise warmLimitC. If your climate is naturally humid, raise humidLimitPercent. The point of named constants is that you can tune the behavior without digging through the drawing code.
You can also change the dashboard colors if you want a different visual language. Keep the same idea, though: each color should mean something. If every card uses a random bright color, the dashboard becomes harder to read instead of easier.
Taking It Further
Once this dashboard works, the most natural upgrade is a small trend indicator. You could store the previous temperature reading and show whether the room is getting warmer or cooler.
You could also add a fan relay, a buzzer, or an LED strip that responds to the same comfort zones. The useful part is that the dashboard already has the decision logic. New outputs can reuse the same labels and thresholds instead of inventing a second rule system.