This article is a guide about the LED Bar Graph. We will explain what it shows, how it works, how to wire it to an Arduino Uno, and how to use it in a practical example you can reuse in your own projects.
An LED Bar Graph is useful when a project needs to show a level instead of a single number. That makes it a good fit for progress indicators, sound level meters, battery-style displays, and any project where the user needs a quick visual readout. It feels much more immediate than reading a raw number on a serial monitor.
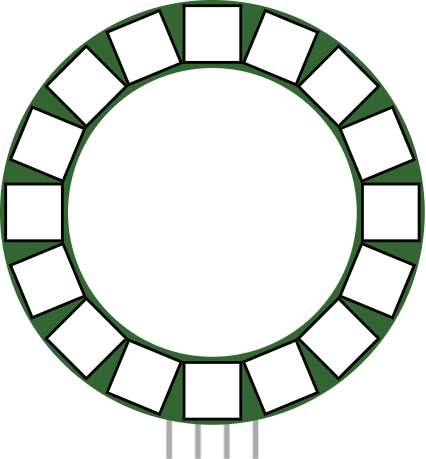
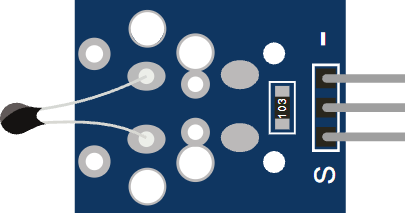
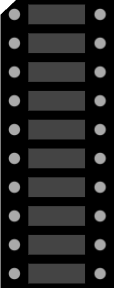
Before we jump into the details, it helps to look at the real module first so the segment layout, pin rows, and compact shape are easier to understand.
Description
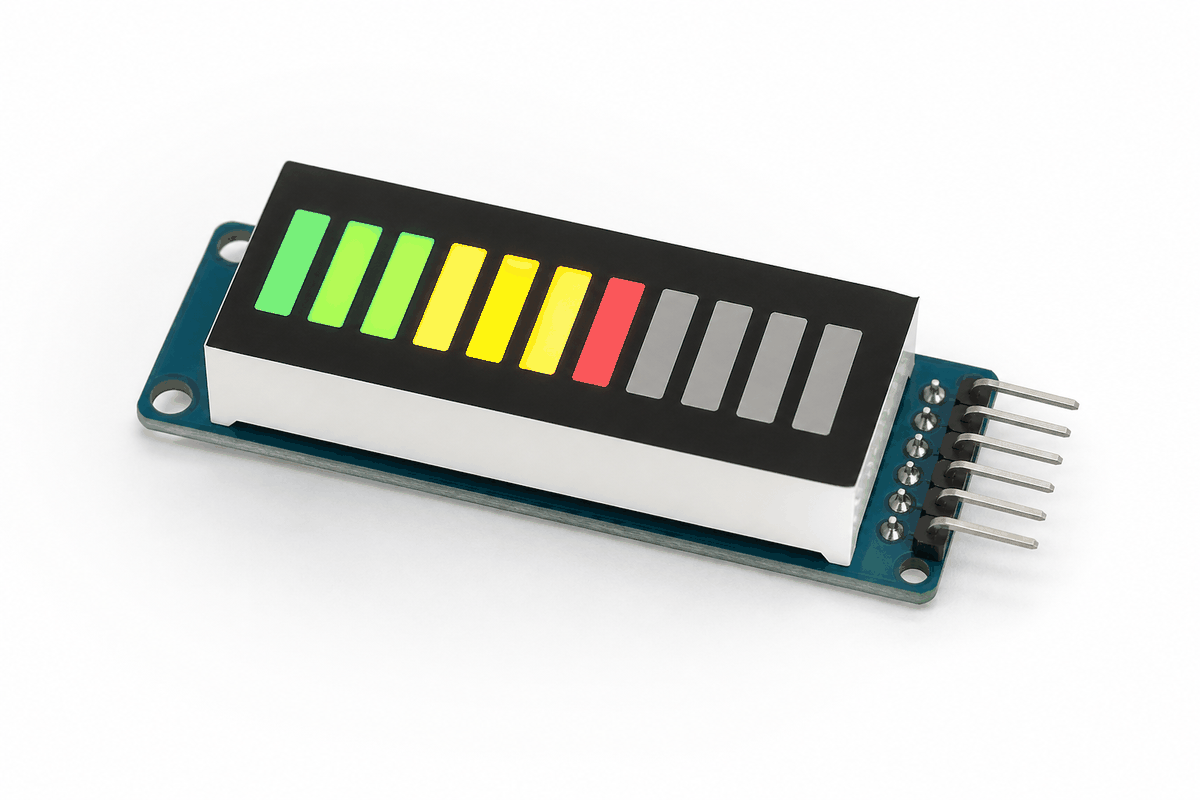
An LED bar graph is a row of LEDs arranged in a line. Each LED can be turned on or off individually, so the whole strip can act like a small visual meter. That makes it useful for showing volume, battery level, sensor strength, or any other value that changes over time.
Unlike an LCD, a bar graph does not show text. Instead, it gives the user a quick visual signal. The more LEDs that are lit, the higher the level appears.
That simple design is one reason the bar graph is common in beginner projects and status indicators. It is easy to understand at a glance, and it reacts quickly when the input value changes.
If you want a circular light effect instead of a straight meter, the LED Ring is the next part worth exploring. It gives you a similar idea, but the circle feels better for sweeps, timers, and animated status effects.
Features
Here are the main things to know about the LED Bar Graph:
| Feature | What it means |
|---|---|
| 10-segment output | Shows a level using ten separate LEDs. |
| Visual meter | Useful for progress, strength, and range indicators. |
| Simple logic | Each LED can be turned on or off directly. |
| Analog friendly | Works well with analogRead() and map(). |
| Easy to read | Lets the user understand a value without reading numbers. |
| Beginner friendly | Good first project for arrays and loops. |
The best part is that you can turn one sensor value into a display the eye understands very quickly.
How Does It Work?
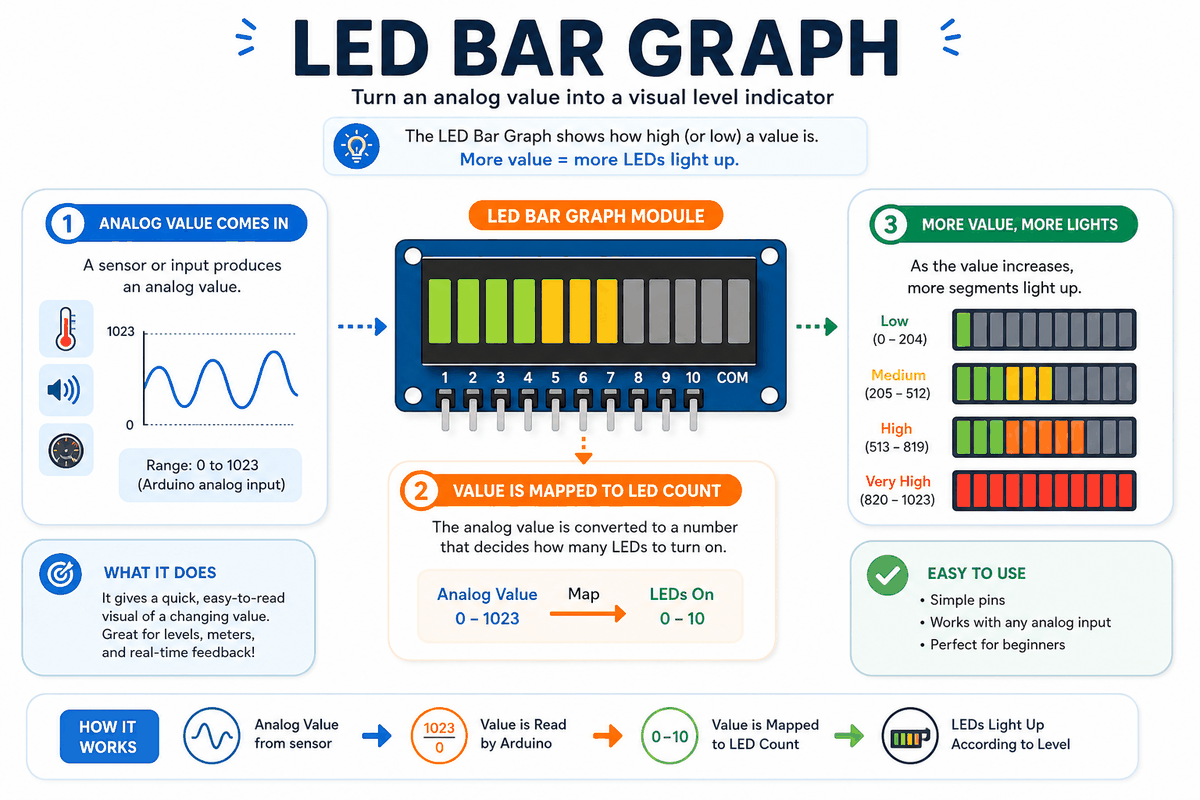
The bar graph works by lighting a growing or shrinking set of LEDs. If the value is low, only the first few segments turn on. If the value is high, more segments light up until the bar looks full.
The Arduino usually reads an analog input, maps that reading to the number of LEDs, and then turns each segment on or off in a loop. That makes the display feel like a live meter instead of a fixed picture, so you can see the change as it happens.
Level Mapping
Mapping is the step that turns the sensor range into a display range. For example, a potentiometer reading from 0 to 1023 can be converted into 0 to 10 lit LEDs. That is the basic idea behind a bar graph meter, and it is what makes the output feel natural instead of random.
Current And Segments
Each LED segment still needs current to be limited safely. When many LEDs are turned on at once, it is important to keep the wiring and resistor values sensible so the display remains stable instead of getting dim or uneven.
Arduino With LED Bar Graph

This circuit preview shows the LED Bar Graph connected to an Arduino Uno so you can understand the layout before reading the sketch. Each segment is controlled separately, which makes the display easy to treat like a live level meter.
Pin Connection
For the Arduino Uno, the connections are straightforward: power and ground feed the module, then each segment gets its own control path. The pin connection map below shows how the pins line up and why each path matters.
Each anode line controls one LED segment so the Arduino can light the bar in order.
Provides the return path for each segment and helps keep the LED current under control.
Powers the bar graph module so the LEDs can light properly.
Shares the same electrical reference as the Arduino Uno.
For a real build, each LED path still needs proper current limiting. When the display starts lighting several segments at once, that small detail is what keeps the output stable and protects the parts from running too hard.
Arduino Code
This example reads a potentiometer and lights the bar graph based on the input value. It is a common way to use a bar display because the result is easy to see immediately and the behavior is simple to test.
The example uses an array so the Arduino can handle the ten LEDs in order. That keeps the sketch short and makes it easier to reuse for other value ranges later.
How The Code Works, Part By Part
Let's break the sketch into smaller parts so the flow is easier to understand and easier to modify later.
Pin Array
The sketch stores the ten LED pins in one array. That lets the loop step through each segment without repeating the same code ten times.
Sensor Read
The Arduino reads the analog input from the sensor or potentiometer. That gives a number between 0 and 1023 on boards like the Uno.
Map To Level
The map() function converts the sensor value into a number from 0 to 10. That number becomes the count of how many LEDs should light up.
Write The LEDs
The loop checks each LED position and turns it on when its index is below the mapped level. That creates the familiar growing bar effect.
Repeat
The short delay keeps the bar graph responsive while still giving the display a steady update rate.
Wrapping Up
The LED Bar Graph is a simple part, but it solves a very practical problem: it turns a changing value into a visual meter that the eye can understand instantly. That is why it works so well for volume indicators, battery-style readouts, sensor bars, and progress displays where numbers would slow the user down.
In real use, the most important details are the mapping and the current path. If the bar seems uneven, dim, or unstable, the usual cause is a wiring issue or a segment being driven too hard. Once those pieces are right, the display feels smooth and predictable, even when several LEDs are lit at the same time.
From here, a good next step is to connect the bar graph to a sound sensor, light sensor, or potentiometer and let the level change in real time. That gives the module a more natural job and makes the project feel much closer to something you would actually build on a workbench.