Build a Smart Climate Monitor with a Raspberry Pi Pico W

Live project track
Keeping indoor spaces healthy and comfortable requires paying attention to both temperature and moisture levels. High humidity encourages mold growth and makes rooms feel muggy, while dry air causes static electricity and irritates your respiratory system. Having a dedicated desk monitor that shows current room conditions at a glance makes it easy to know when to open a window or adjust your thermostat.
In this project, you will build a smart climate monitor using a Raspberry Pi Pico W, a digital DHT22 temperature and humidity sensor, and a high-contrast 128x64 SSD1306 OLED display. You will learn how to read digital environmental data, draw custom text and status cards onto an OLED screen over a two-wire I2C bus, pulse a heartbeat activity LED, and format structured JSON readings over USB serial.
Digital Climate Sensing with the DHT22
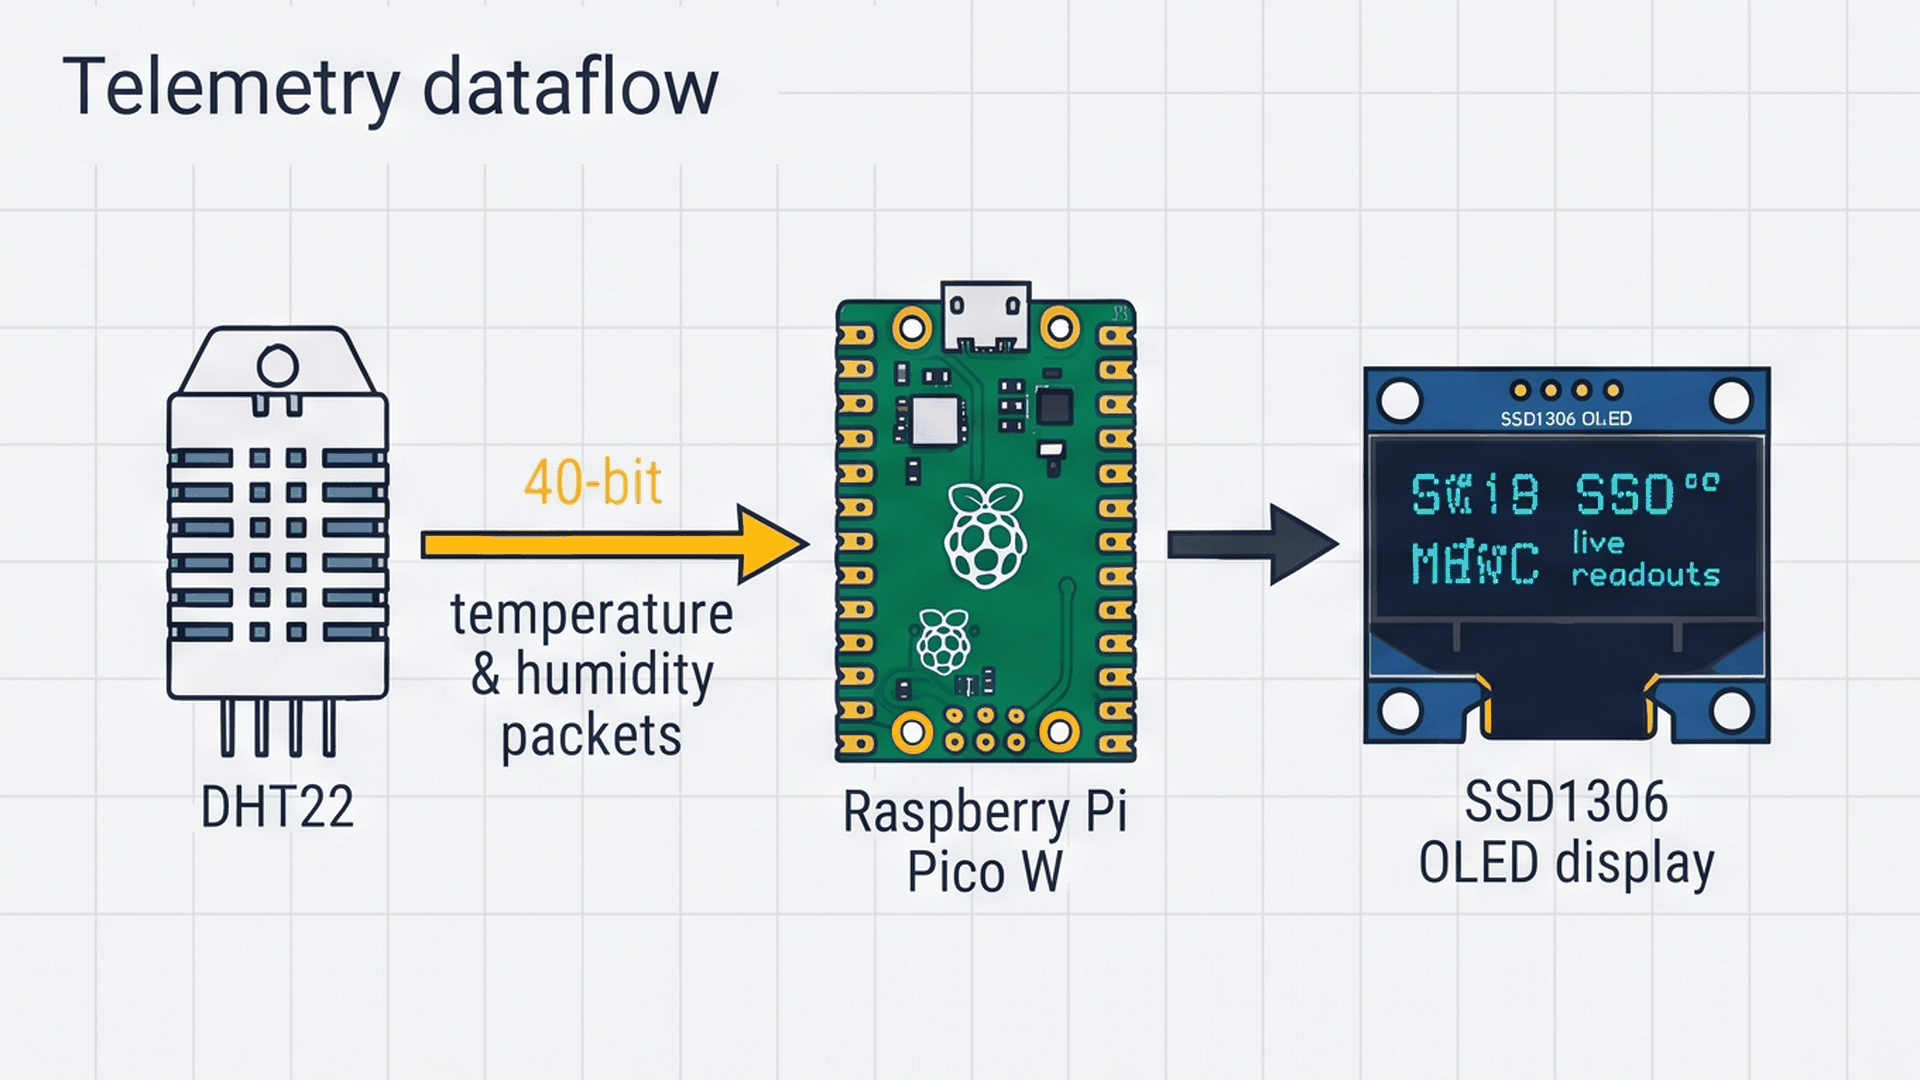
Unlike analog temperature sensors that output small variable voltages prone to electrical noise, the DHT22 sensor contains its own internal measurement chip. It measures temperature using an internal thermistor and humidity using a capacitive moisture element, converts the readings into digital numbers, and sends them out as a clean series of binary pulses over a single data wire.
| Climate Metric | Measurement Range | Accuracy | Sampling Rate |
|---|---|---|---|
| Ambient Temperature | -40°C to +80°C | ±0.5°C | Every 2 seconds (0.5 Hz) |
| Relative Humidity | 0% to 100% RH | ±2% to ±5% RH | Every 2 seconds (0.5 Hz) |
| Operating Voltage | 3.3V to 5.5V DC | Regulated on-board | Draws ~1 mA during reading |
| Data Output Format | Digital single-wire pulses | Verified by checksum | Sent to pin GP2 on Pico W |
Because the DHT22 requires approximately two seconds between readings to stabilize its internal sensing elements, our firmware updates the screen every two seconds. Querying the sensor any faster would cause internal self-heating and produce inaccurate temperature readings.
Driving a Graphical OLED Display Over I2C
Traditional character LCDs can only show fixed grids of text letters. In contrast, an SSD1306 OLED display gives you a graphical canvas of 128 pixels wide by 64 pixels tall—a total of 8,192 individual self-lit pixels. This allows you to draw dividing lines, vary font sizes, and create a modern dashboard layout.
| Screen Region | Pixel Coordinates | Visual Element | Function on Dashboard |
|---|---|---|---|
| Top Header Bar | Y = 0 to 10 | System Title & Status Line | Displays 'PICO-W [WiFi:OK]' with an underline |
| Temperature Card | Y = 18 to 36 | Large Double-Sized Number | Shows current temperature in °C with decimal precision |
| Humidity Card | Y = 44 to 62 | Large Double-Sized Number | Shows relative humidity percentage (e.g. 58.2 %) |
| I2C Communication | Pins GP4 & GP5 | Hardware I2C Bus @ 400 kHz | Transfers full screen buffer in a single burst |
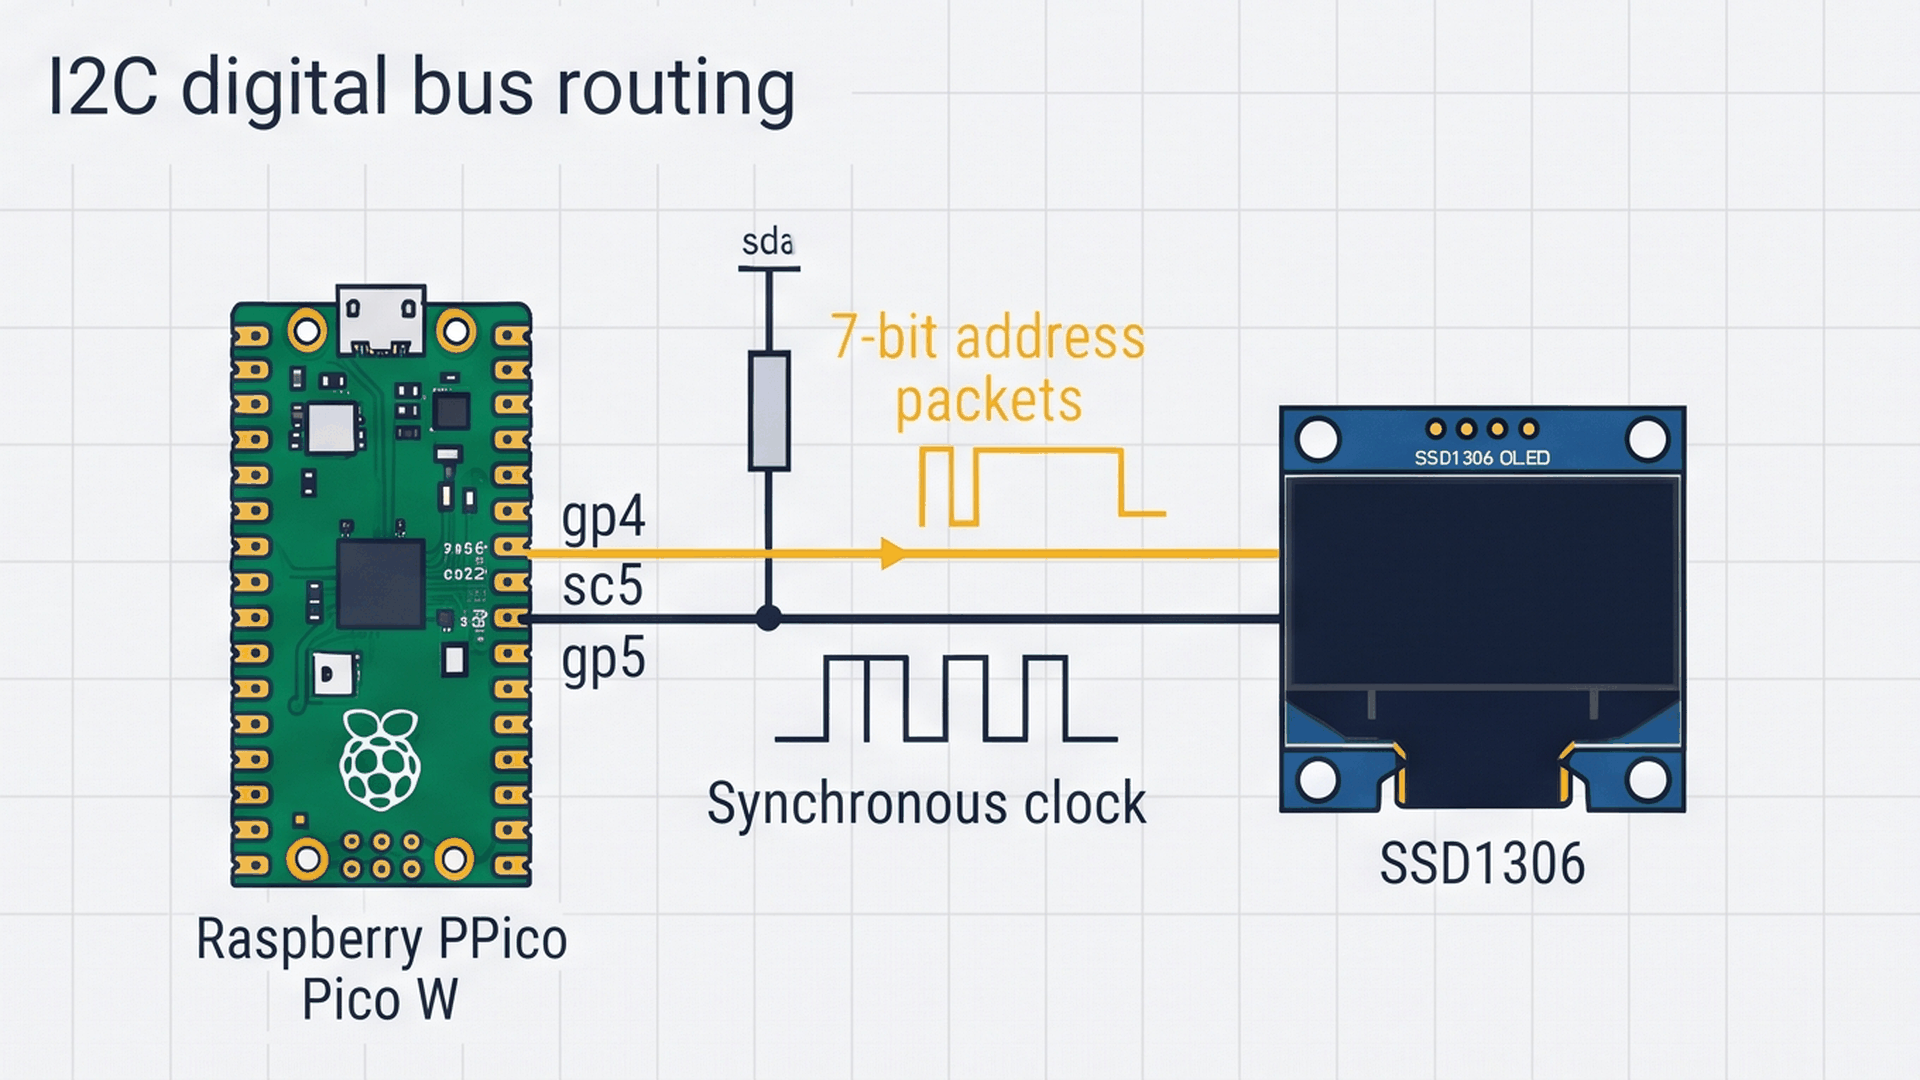
On the Raspberry Pi Pico W, the hardware I2C controller can be routed to different GPIO pins using software commands. By calling Wire.setSDA(4) and Wire.setSCL(5), we assign pins GP4 and GP5 to handle display communication, leaving other pins completely free.
Everyday Magic: Room Comfort at a Glance
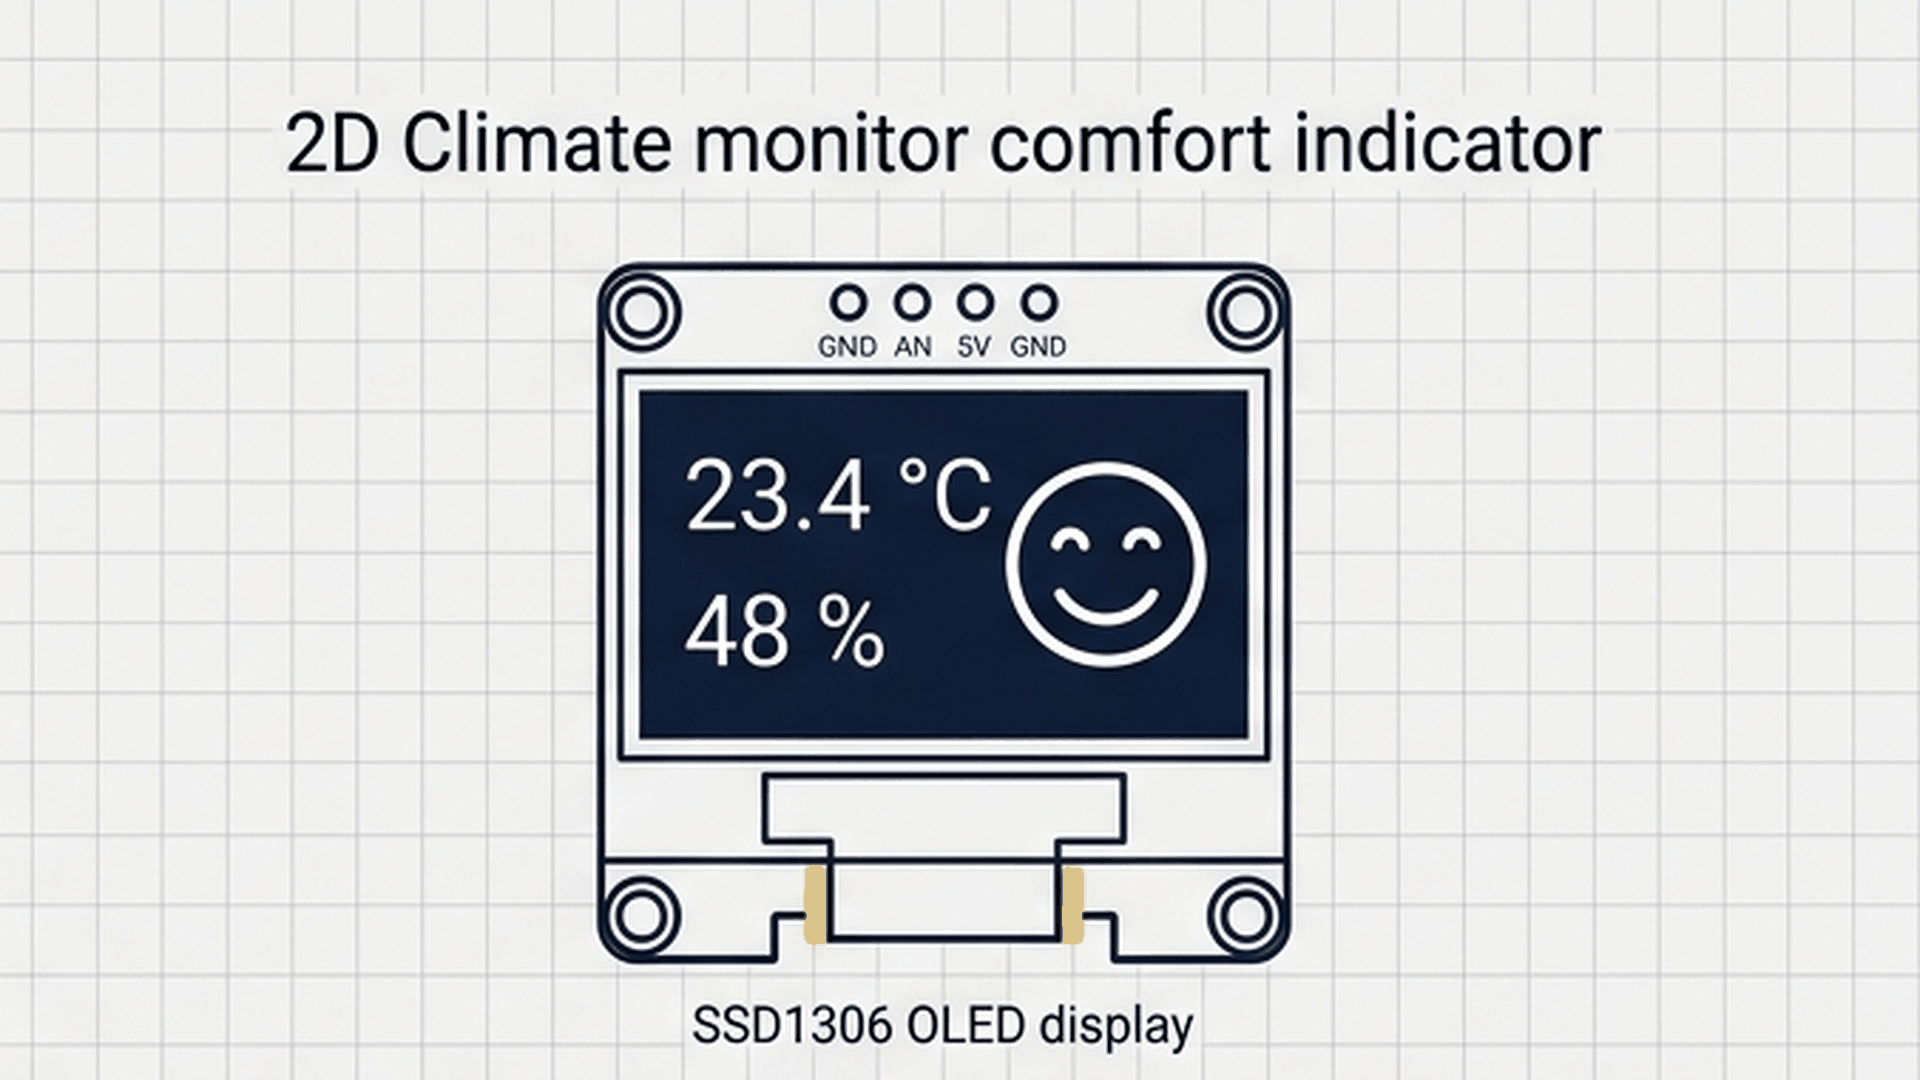
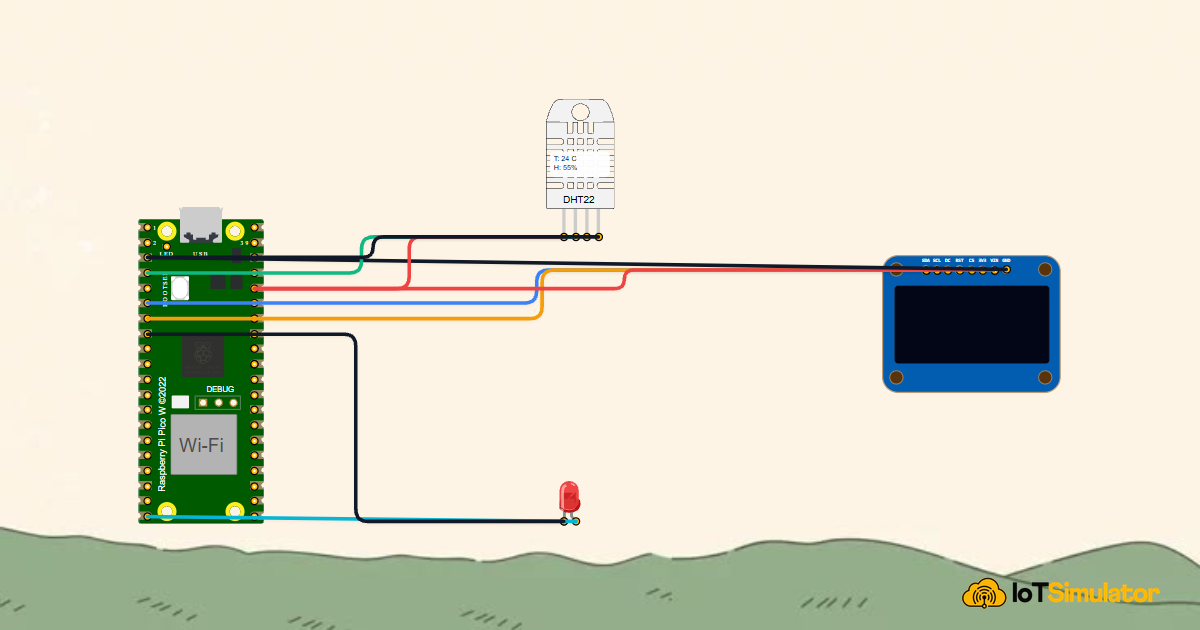
Think of this project like a desk weather companion. Instead of just displaying plain digits that you have to analyze, the Raspberry Pi Pico W evaluates the comfort index. When the room is between 20°C and 26°C with moderate humidity, it displays a cheerful smiling face. When the air turns sweltering or muggy, it instantly warns you to open a window or turn on a fan. The interactive connection tables below show how each module connects to the Raspberry Pi Pico W.
The DHT22 data pin connects directly to pin GP2 on the Pico W. Because DHT22 sensor modules include an on-board pull-up resistor on the data line, you do not need an external resistor on your breadboard.
The SSD1306 OLED uses standard I2C wiring: SDA connects to GP4 and SCL connects to GP5. Built-in pull-up resistors on the OLED breakout module ensure clean high-speed clock and data signals.
The blue LED on pin GP15 serves as an activity indicator. It flashes briefly each time the Pico W queries the DHT22 and refreshes the screen, confirming at a glance that the monitoring loop is actively running.
Complete Code
Here is the full Arduino sketch for your smart climate monitor. Upload this code to your Raspberry Pi Pico W and open the Serial Monitor at 115200 baud to view incoming JSON telemetry:
// ============================================================================
// Raspberry Pi Pico W Smart Climate Monitor with OLED
// DHT22 Climate on GP2
// SSD1306 128x64 OLED on GP4 (SDA) & GP5 (SCL)
// Telemetry Heartbeat LED on GP15
// ============================================================================

#include <Wire.h>
#include <Adafruit_GFX.h>
#include <Adafruit_SSD1306.h>
#include <DHT.h>

#define SCREEN_WIDTH 128
#define SCREEN_HEIGHT 64
Adafruit_SSD1306 display(SCREEN_WIDTH, SCREEN_HEIGHT, &Wire, -1);

#define DHTPIN 2
#define DHTTYPE DHT22
DHT dht(DHTPIN, DHTTYPE);

const int HEARTBEAT_LED = 15;

void setup() {
  Serial.begin(115200);
  delay(200); // USB settling delay

  // Configure hardware I2C0 pins on Raspberry Pi Pico W
  Wire.setSDA(4);
  Wire.setSCL(5);
  Wire.begin();

  dht.begin();
  pinMode(HEARTBEAT_LED, OUTPUT);

  if (!display.begin(SSD1306_SWITCHCAPVCC, 0x3C)) {
    Serial.println(F("SSD1306 OLED initialization failed!"));
    while (1);
  }

  display.clearDisplay();
  display.setTextSize(1);
  display.setTextColor(SSD1306_WHITE);
  display.setCursor(18, 26);
  display.print(F("PICO W IOT NODE"));
  display.display();
  delay(1200);
}

void loop() {
  // Pulse heartbeat activity LED
  digitalWrite(HEARTBEAT_LED, HIGH);

  // 1. Read calibrated digital climate telemetry from DHT22
  float h = dht.readHumidity();
  float t = dht.readTemperature();

  // 2. Render graphical dashboard onto 128x64 OLED
  display.clearDisplay();

  // Top Header Status Banner
  display.setTextSize(1);
  display.setCursor(0, 0);
  display.print(F("PICO-W  [WiFi:OK]"));
  display.drawLine(0, 10, 128, 10, SSD1306_WHITE);

  // Temperature Card
  display.setCursor(4, 18);
  display.print(F("Temp: "));
  display.setTextSize(2);
  if (isnan(t)) display.print(F("--.- "));
  else display.print(t, 1);
  display.setTextSize(1);
  display.print(F(" C"));

  // Humidity Card
  display.setCursor(4, 44);
  display.print(F("Hum : "));
  display.setTextSize(2);
  if (isnan(h)) display.print(F("--.- "));
  else display.print(h, 1);
  display.setTextSize(1);
  display.print(F(" %"));

  display.display(); // Burst framebuffer over I2C

  // 3. Format structured JSON payload over high-speed Serial
  Serial.print(F("{\"node\":\"pico-w-01\",\"temp\":"));
  Serial.print(t, 2);
  Serial.print(F(",\"humidity\":"));
  Serial.print(h, 2);
  Serial.println(F("}"));

  digitalWrite(HEARTBEAT_LED, LOW);
  delay(2000); // 2-second telemetry refresh cycle
}
How the Code Works, Part by Part
The firmware follows three distinct stages: setting up the communication buses, acquiring sensor readings, and updating both the visual display and serial telemetry.
Initializing I2C Pins and the OLED Screen
In setup(), the code explicitly maps the Pico W's hardware I2C peripheral to the chosen pins before booting the screen:
Wire.setSDA(4);
Wire.setSCL(5);
Wire.begin();

if (!display.begin(SSD1306_SWITCHCAPVCC, 0x3C)) {
  Serial.println(F("SSD1306 OLED initialization failed!"));
  while (1);
}
Setting pins GP4 and GP5 ensures the I2C library communicates on the correct header pins. Address 0x3C is the standard 7-bit I2C address used by most 0.96-inch SSD1306 OLED displays.
Reading Climate Metrics and Handling Errors
At the start of loop(), the DHT library samples the sensor and converts the pulses into floating-point numbers:
float h = dht.readHumidity();
float t = dht.readTemperature();

if (isnan(t)) display.print(F("--.- "));
else display.print(t, 1);
Single-wire digital sensors can occasionally miss a pulse if communication timing fluctuates. The isnan() check detects when an invalid reading occurs, displaying placeholder dashes instead of corrupting the screen layout.
Drawing the Dashboard and Outputting JSON
After rendering text and lines in memory, display.display() sends all pixel data to the OLED in one fast burst, while Serial outputs a structured JSON string:
display.display();

Serial.print(F("{\"node\":\"pico-w-01\",\"temp\":"));
Serial.print(t, 2);
Serial.print(F(",\"humidity\":"));
Serial.print(h, 2);
Serial.println(F("}"));
Formatting data as JSON makes it easy for desktop programs, Node.js servers, or cloud dashboards to parse incoming readings automatically without needing custom text scrapers.
Fixing Common Problems
If your OLED monitor is blank or showing incorrect values, review the table below for quick fixes:
| Observed Problem | Likely Cause | How to Fix |
|---|---|---|
| OLED screen remains completely black | Incorrect I2C address or swapped SDA/SCL wires | Verify address is 0x3C in code, and ensure SDA connects to GP4 and SCL connects to GP5. |
| Temperature displays '--.- C' constantly | DHT22 data pin wired to wrong header pin | Verify that the sensor data lead connects to pin GP2 (Physical Pin 4) on the Pico W. |
| Screen content appears scrambled or offset | Display dimensions mismatch in library | Ensure SCREEN_WIDTH is set to 128 and SCREEN_HEIGHT is set to 64. |
| Serial Monitor displays unreadable symbols | Terminal baud rate mismatch | Set the Serial Monitor baud rate in the bottom right corner to 115200 baud. |
If the screen fails to start, verify your 3.3V power and ground jumpers with a multimeter to ensure stable voltage is reaching both modules.
Try It in the Simulator
Click the Start Simulation button in the top toolbar to boot up your climate node. Click on the DHT22 sensor to reveal its interactive temperature and humidity sliders. Move the temperature slider up to 30°C and humidity to 75%: watch the OLED screen update with large crisp numbers and observe the formatted JSON string print to the Serial Monitor console.
More in Raspberry Pi Pico W
More in Sensors
Build a Light Meter and Alarm with a Raspberry Pi Pico
Build a Multi-Room Safety Monitor with an Arduino Mega
Build a Motion Security Chime with an Arduino Nano
Build an Automatic Night Light with an Arduino Nano
Measure Distance with an ESP32-C3 and Ultrasonic Sensor
More in Intermediate
Build a Multi-Room Safety Monitor with an Arduino Mega
Build a Keypad Door Lock with an Arduino Mega
Control a Pan and Tilt Servo with an Arduino Mega and Joystick
Read an 8-Bit DIP Switch with an Arduino Mega